
View/Hide Results
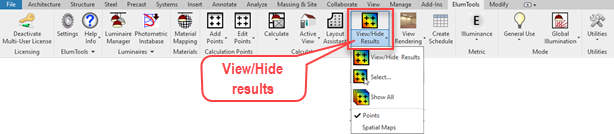
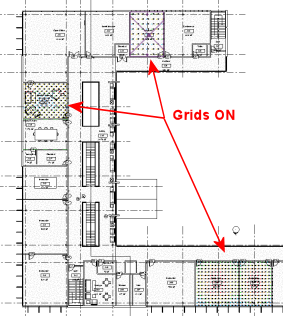
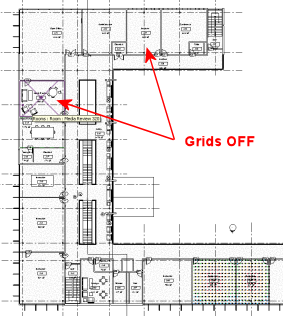
Once a calculation has been completed in ElumTools, you can enable the results in the Revit views of choice using the View Results command. A single click on the button will turn all grids on, a second click will turn them off, acting as a toggle. All point-by-point grids that are visible in the selected 2D view will be displayed. In 3D views, the command's default behavior will make all point grids visible, regardless of level.
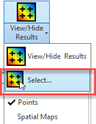
The results display can be the individual points (point-by-point ), or the Spatial Map shaded representations, however, they cannot be enabled simultaneously.
|

|
|
|
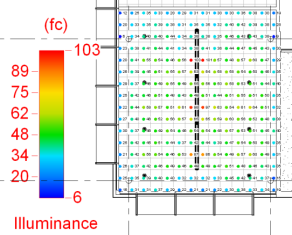
Illuminance calculation points visible in a ceiling plan view. |
Calculation points visible in a 3D view. The points in the right side are placed using a Room or Space Workplane. The points on the left are two different Planar Face point families: one on the table top and one on the wall. |
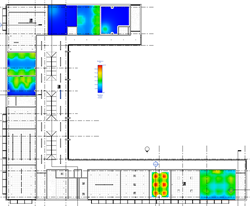
Spatial Maps visible in a ceiling plan view. Note the single scale applies to all visible maps. |
|
|
Best Practices - You may encounter a situation where you have numerous interior grids and several exterior grids visible in one view. This will be undesirable with the Spatial Map display as the illuminance values will typically be much higher indoors. This will skew the spatial map scale such that the exterior maps will appear very dark. In this case you can hide the calc points family marker for the exterior grids in the view, or deselect them using the Select option. Enable the exterior maps in a different view.
Analysis Results
|
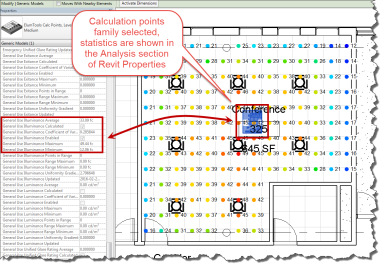
Select the Calculation Points family The statistical results for any calculation grid can be viewed in the Revit Properties window (Analysis section) by selecting the calculation points family contained in the boundary. In the view shown at right, the family is selected and the statistics are shown under "Analysis Results".
All analysis results are available to be scheduled. See link below.
All ElumTools calculation results are available for Revit Schedules. |
|
|
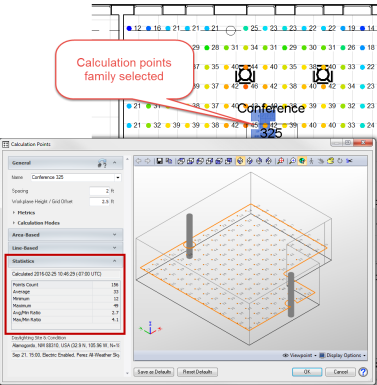
View statistics with Edit Points command Statistics for any computation are also available using the Edit Points command to select the calculation point family. |
|
Display options
ElumTools uses Revit's Analysis Visualization Framework (AVF) to assist in the display of calculated values. This tool makes it easy to adjust the display style of the calculation points. By selecting the properties of the Revit view, it is possible to access the "Analysis Display Settings" and the "Default Analysis Display Style."
See also: Calculation Points - Display Styles